If you’re torn between Cranston and Providence, you’re not really choosing between two dots on a map. You’re choosing between two different home search experiences, two different housing mixes, and two different ways your monthly costs may play out. The good news is that both cities can be strong options, and a side-by-side look can make your decision much clearer. Let’s dive in.
Start With the Big Difference
At a high level, Cranston tends to feel more suburban and ownership-oriented, while Providence offers a more urban mix with greater variety in housing types. That difference shows up in prices, property styles, taxes, and even how your day-to-day routine may feel.
In March 2026, the median sale price in Cranston was $499,900. In Providence, it was $645,000. That means Providence was about $145,100 higher, or roughly 29% more, based on that month’s market snapshot.
Homes also moved a little faster in Providence. The average home sold in 35 days there, compared with 48 days in Cranston. If you are shopping in Providence, that may mean being prepared to move quickly when the right property appears.
Compare Budget and Buying Power
For many buyers, budget is the first filter. Based on current pricing, Cranston is typically the lower-entry market, while Providence often requires more upfront capital.
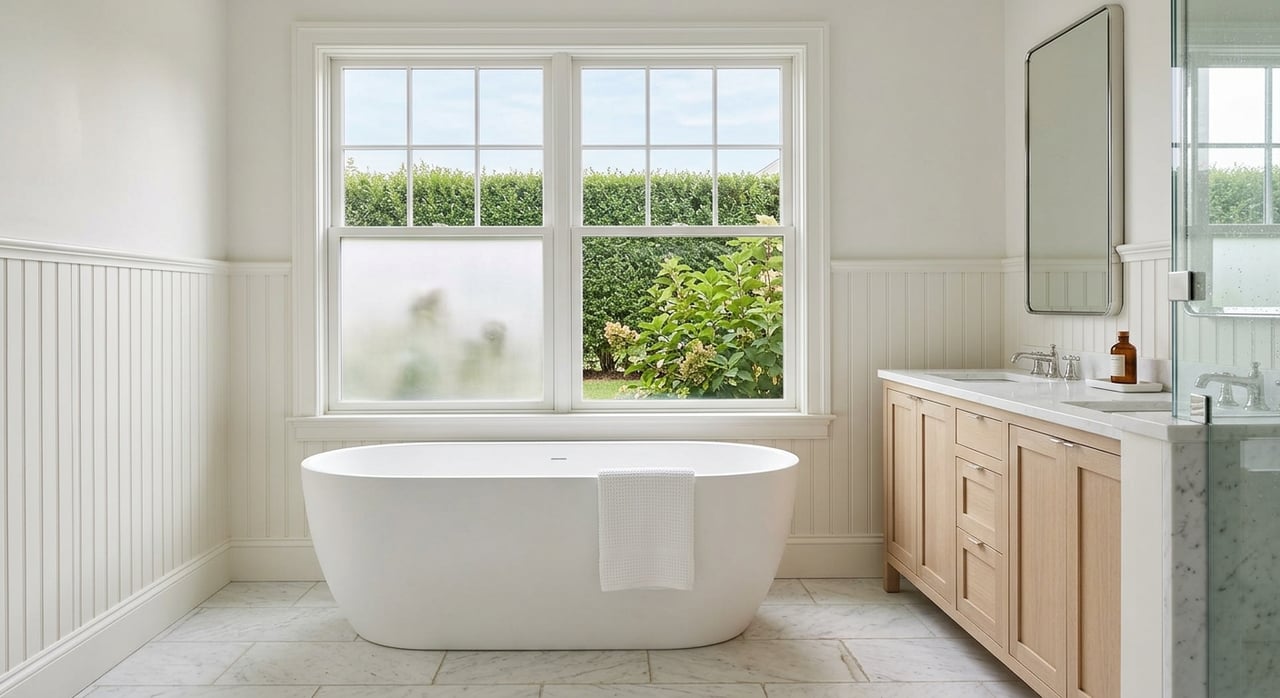
That does not automatically make Cranston the better value for every buyer. Providence may offer housing types that better match your goals, especially if you want a condo, a two-family, or a three-family property. Still, if your top priority is getting into a single-family home at a lower median price point, Cranston may give you more breathing room.
Census data also shows a difference in household income. Cranston’s median household income is $90,206, compared with $68,119 in Providence. While every buyer’s finances are unique, that gap helps explain why Cranston often reads as the more budget-comfortable option in the local market.
Look at Housing Types First
Cranston Offers More Single-Family Homes
If you picture a traditional single-family home as your ideal fit, Cranston may line up more naturally with your search. About 65.7% of Cranston’s housing stock is single-family, and the city has a 67.6% owner-occupied housing rate.
That points to a market that is more geared toward homeownership and detached homes. Cranston’s planning materials also emphasize village centers and strong freeway access, which supports a more conventional suburban pattern.
Cranston’s housing stock is not brand new, though. The median year built is 1958, and the city reports that 75% of owner-occupied homes were built before 1979. If you buy there, you may still want to evaluate systems, maintenance needs, and renovation potential carefully.
Providence Offers More Variety
Providence has a much more mixed housing inventory. Only 19.3% of its housing units are single-family, while 44.6% are two- and three-family homes, and more than 25% are multifamily.
That broader mix gives you more ways to search. You may find condos, multi-family properties, historic homes, and homes in denser urban settings, along with some outer neighborhoods that have more single-family housing.
Providence’s owner-occupied rate is 41.4%, much lower than Cranston’s. That helps reinforce the city’s more renter-heavy and multifamily-heavy profile. If you want options beyond the standard single-family search, Providence often gives you more inventory paths to explore.
Factor in Property Age and Upkeep
Older housing stock can offer character, location, and flexibility, but it can also bring maintenance and modernization costs. This is an important part of the Cranston versus Providence decision.
In Cranston, most owner-occupied homes were built before 1979. In Providence, the housing stock is even older. Nearly 60% of units were built before 1950, more than 83% before 1979, and only about 2% were built since 2010.
For buyers, that means Providence may offer more historic and multi-unit opportunities, but also a greater chance that you will need to budget for updates, repairs, or accessibility improvements. This is where having an advisor who can help you think through condition, renovation scope, and cost can make a real difference.
Property Taxes Can Change the Math
This is one of the biggest practical differences between the two cities. A home’s sticker price matters, but your annual carrying costs matter too.
Cranston uses a flatter residential tax structure. For FY2025-2026, the tax rate for 1-5 unit family dwellings and residential vacant land is $13.88 per $1,000 of assessed value.
Providence uses class-based rates for FY26, and those rates depend heavily on how the property is used. Owner-occupied single-family homes are taxed at $8.40 per $1,000, while non-owner-occupied single-family homes are taxed at $14.60 per $1,000. Owner-occupied 2-5 unit homes are taxed at $7.55 per $1,000, while non-owner-occupied 2-5 unit homes are taxed at $14.00 per $1,000.
On a $500,000 assessed home, that works out to about:
- Cranston: $6,940 per year
- Providence owner-occupied single-family: $4,200 per year
- Providence non-owner-occupied single-family: $7,300 per year
This is why ownership structure matters so much in Providence. If you plan to live in the property and qualify for the owner-occupied rate, Providence may be tax-favorable. If you are buying a non-owner-occupied property, the tax picture can look very different.
Think About Lifestyle, Not Just Location
Cranston Feels More Suburban
Cranston has a lower population density and a more suburban-large classification. It has about 2,925.9 people per square mile across 28.35 land square miles.
That usually translates into a different daily rhythm. If you want a more car-oriented setup, more detached-home inventory, and a suburban environment with multiple village centers, Cranston may feel like the more natural match.
Providence Feels More Urban
Providence is much denser, with about 10,373.5 people per square mile across 18.41 land square miles. Its housing strategy highlights demand for walkable, transportation-accessible areas, especially in and around Downtown Providence.
That supports a more urban experience overall. If you want more walkability, more mixed housing types, and a broader range of neighborhood formats from urban core to more residential outer areas, Providence may fit better.
Commute Times Are Surprisingly Similar
Many buyers assume Cranston and Providence will create very different commute patterns. On average, the numbers are actually close.
The mean travel time to work is 24.3 minutes in Cranston and 25.0 minutes in Providence. That suggests your decision may come down less to average commute time and more to the type of home and setting you want.
In other words, if you are deciding between these two cities, lifestyle and housing stock may be more useful filters than commute averages alone.
Schools Require a Closer Look
If schools are part of your decision, it helps to compare them carefully at the school level rather than relying on broad assumptions. The two districts differ in size and setting.
Providence Public Schools is classified by NCES as a regular local school district with 37 schools, 20,250 students, and a student-teacher ratio of 14.90. Cranston Public Schools has 23 schools, 10,037 students, and a student-teacher ratio of 12.63. NCES classifies Providence as City, Midsize and Cranston as Suburban, Large.
Rhode Island’s school report cards use multiple measures, including academic achievement, graduation rates, chronic absenteeism, and student growth, with schools receiving 1-to-5-star ratings. That means a school-by-school review is the most useful approach if this factor matters in your search.
Which Buyers Often Prefer Cranston?
Cranston may be a stronger fit if you are looking for:
- More single-family inventory
- A more ownership-oriented market
- A suburban setting
- Slightly lower median sale prices
- A simpler residential tax structure to model
This can be especially appealing if you want predictability in your search and are focused on a more traditional owner-occupied home purchase.
Which Buyers Often Prefer Providence?
Providence may be a stronger fit if you are looking for:
- More condos and multifamily options
- More urban density and walkability
- More neighborhood variety
- Owner-occupied tax advantages, if you qualify
- Opportunities in two-family or three-family housing
This can be especially helpful if you want flexibility in how you live, invest, or use the property over time.
The Bottom Line on Cranston vs Providence
The choice between Cranston and Providence is usually less about which city is “better” and more about which one fits the way you want to live and buy. Cranston tends to make sense if you want a more suburban ownership experience, more single-family homes, and a lower median price point. Providence tends to make sense if you want housing variety, a more urban setting, and tax advantages tied to owner occupancy.
If you want help comparing specific neighborhoods, monthly costs, or renovation tradeoffs in either market, Lindsay Pettinelli can help you break down the numbers and find the right fit for your goals.
FAQs
What is the price difference between Cranston and Providence homes?
- In March 2026, Cranston’s median sale price was $499,900 and Providence’s was $645,000, making Providence about $145,100 higher.
Is Cranston or Providence better for single-family homes?
- Cranston generally offers more single-family inventory, with 65.7% of its housing stock classified as single-family compared with 19.3% in Providence.
Is Providence or Cranston better for multifamily buyers?
- Providence usually offers more options for multifamily buyers because 44.6% of its housing stock is made up of two- and three-family homes, plus more than 25% is multifamily.
How do property taxes compare in Cranston and Providence?
- Cranston has a flatter residential tax rate, while Providence uses class-based rates that can be more favorable for owner-occupied homes and less favorable for non-owner-occupied properties.
Are commute times different in Cranston and Providence?
- Average commute times are very similar, with mean travel times of 24.3 minutes in Cranston and 25.0 minutes in Providence.
How should you compare schools in Cranston and Providence?
- The best approach is to review schools individually using Rhode Island’s report card system, since district size and school options vary and school-by-school differences matter more than one overall label.